|
2D/3D Acoustic Propagation Modeling:
2D focusing by a cylindrical “fast” lens
at finite wavelengths. 2D surface acoustic wave resonance in co-directional strip waveguides. Waveguides are used in a variety
of devices where it is desirable to channel or contain propagating
wave energy within spatial boundaries. Common examples include surface
acoustic wave (SAW) filters and optical fibers. 2D reduced-velocity
strips are often used as SAW waveguides. An image from a finite-difference
time-domain (FDTD) simulation of a single reduced-velocity waveguide
strip is shown below. Figure 1 illustrates a snapshot of the amplitude
field of a continuously propagating acoustic mode 0 wavefunction
as it travels along a reduced-velocity strip guide. The guide lies
parallel to the X-axis, and is centered halfway along the Y-axis
range.
An alternative way of illustrating the energy containment achieved by the strip waveguide of Figure 1 is to plot intensity instead of amplitude. Figure 2 illustrates normalized intensity versus distance along the guide for the same type of simulation shown in Figure 1.
 Figure 2. Normalized intensity for a mode 0 guidefunction propagating down a reduced-velocity strip waveguide.
Strip waveguides placed side-by-side are referred to as co-directional guides. One interesting aspect of co-directional guides is the potential for resonance to occur. Figure 3 illustrates what happens when two co-directional reduced-velocity strip waveguides are located close enough to resonate. Normalized intensity is illustrated over a section of the grid for the case when a mode 0 guidefunction is sourced into one of the waveguides. Oscillations in energy between the guides are apparent.
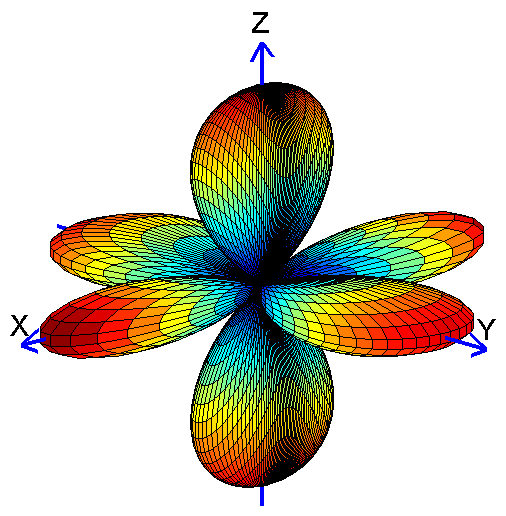
In this example, the far-field emission pattern for a square arrangement of 4 point sources lying in the y-z plane (see Figure 4) is computed. The emission pattern for such a simple source arrangement can be analytically calculated, but is computed here to illustrate the technique. The power of this approach is best seen in cases of complex source regions (for example, see the acoustic emission modeling of dolphin head tissues in the Bioacoustic Modeling section) for which no analytical solution is available. Closely related techniques also allow one to calculate the scattered acoustic field from complex structures (including modeled tissues).
Figure 4. Four point sources in the y-z plane arranged in a square configuration of side length s=0.9 l.
To calculate the pattern
below, the following procedure was used:
Figure 5. Polar plot of far-field intensity for the four point sources of Figure 4 (in phase).
3D polar plots of peaked emission data are visually striking, but other types of plots often permit clearer visualization of emission patterns over all spherical angles. The figures below plot the same emission data in a flattened global projection. In this projection, center-map corresponds to the positive x-direction, "Above" corresponds to the positive z-direction, "L"=left corresponds to the positive y-direction, etc.
Figure 6. Global plots of same emission data as in Figure 5. Top figure: Surface plot of data colored by decibel level. Bottom figure: Decibel contour plot. Center-map is positive x-direction, "Above" is positive z-direction, "L"=left is positive y-direction, etc.
|
 |